Drowning in Data to Event Management
Leveraging Water Network Data for System Management Prioritization
Knoxville Utilities Board (KUB) is an independent agency of the US City of Knoxville, Tennessee, providing electric, natural gas, water, and wastewater services to more than 453,000 customers in Knoxville and parts of seven surrounding counties.
KUB’s water system has experienced 30 percent to 35 percent non-revenue water over the past 10 years; hard-to-find underground leaks are the big culprit. Reducing leaks improves customer service, increases operational efficiency, reduces expenses for chemicals and power, and has other benefits.
Background – Addressing Water Loss
In a water loss reduction initiative, KUB invested in the implementation of District Metered Areas (DMAs). DMAs partitioned the water network into 44 small areas serving no more than 3,000 customers, making it easier to find the leaks. A total of 102 pressure sensors and flow meters were installed to monitor the network within each DMA.
Flow and pressure sensors record measurements every 15 minutes and transmit the data daily to a central server where the entire water distribution data is stored. As a result, KUB is generating a huge amount of data that provides the performance signature of the network base on individual sensor readings over hours, days, and months of continuous monitoring.
Analyzing the sensor data can identify network performance anomalies, specifically levels of water loss. KUB’s basis for implementing the system was to evaluate areas of water loss through DMA level analysis and prioritize leak detection and repair. With a few DMAs and sensors, KUB could process the data using spreadsheets to evaluate the sensor data and DMA performance. As 102 sensors incrementally came on line, however, evaluating the growing data became much more difficult.
The Need for Data Analytics
KUB identified objectives and expectations for using data to manage water loss and overall system performance.
Highest cost water loss management approach is pipe replacement. KUB decided to use a data analytics strategy to gain greater insights into areas and alternative methods for water loss reduction.
Comparison of DMAs to find DMAs that have high water loss to best manage leakage.
Focus leak detection and reduction on a few DMAs to drive water loss down.
Prior efforts tended to stop the rising leaks, but not reduce the total level of leaks. The goal was to systematically drive the leak levels downward through detection, repair, and other management methods.
Use of complete water cost by DMA to help prioritize zones including the basic water production, energy, communication, engineering, operations costs. Complete water costs could help with priority setting to achieve goals broader than total water loss.
Share network performance data between co-workers and other work groups.
The TaKaDu Event Management Solution
KUB tapped TaKaDu to meet its system management objectives and harness the vast data volumes to present KUB’s system performance characteristics in meaningful ways. TaKaDu uses IoT cloud-based technology that provides an event management solution.
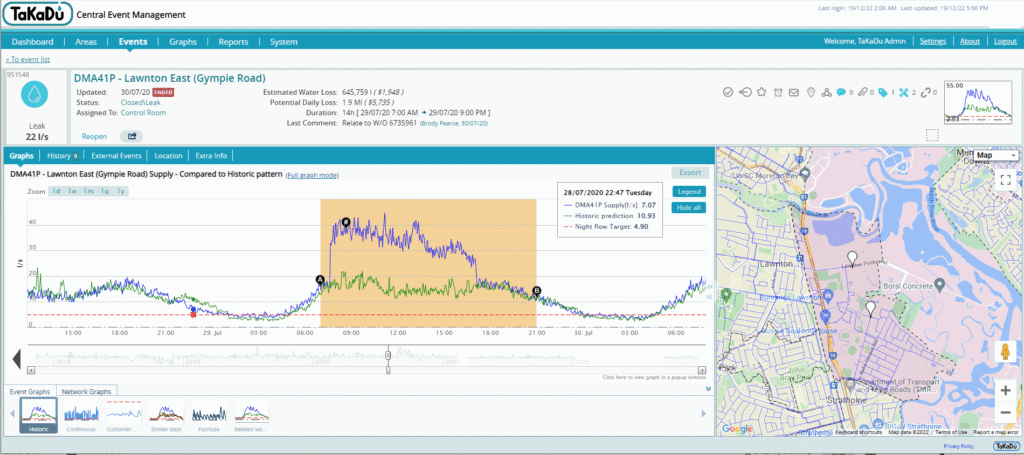
As a big data solution, TaKaDu’s event management capabilities consume and analyze the sensor and meter data with advanced analytics to automatically detect, analyze and manage various types of water network events. Events include leaks, bursts, pressure transients, faulty assets and telemetry network integrity. TaKaDu evaluates all sensor data over months of readings to identify events by correlating data from multiple sensors and DMAs along with SCADA production data. Event detection is an automatic process.
An event is characterized by its type, its size, and trends; TaKaDu’s data solution automatically identifies correlations with other events, such as a main break or pressure drop. Event notification is automatically sent to KUB personnel based on their roles and responsibilities. Events are relevant and actionable for KUB because of their discrete classification and characteristics. Using TaKaDu’s solution, KUB reviews the event locations, magnitude and trends to prioritize, monitor and resolve the events.
“TaKaDu’s event management paradigm has transformed the flood of incomprehensible data into meaningful information that the KUB organization can effectively use,” said Ted Tyree, Engineer, Water Systems Engineering at KUB. “Almost immediately, our engineers could ‘see’ the water distribution network and understand where potential problems exist, the type, and the magnitude. With that snapshot, we could easily determine whether to monitor or act on each one.”
Managing the water network operations, fixing leaks, and engineering network changes had historically been accomplished with basic network information and a set of assumptions. A welcome revelation was the significant insights provided by TaKaDu, which helped quickly to clarify issues and characteristics of specific areas of the system.
Tyree continued, “It became evident that water engineering required a data management and analysis solution. TaKaDu’s solution is based on data science; its engineers and system deployment specialists are data experts bringing skills to KUB that enable our engineers to have much greater insight into the water system.”
Benefits & Results
“They committed to deployment within eight weeks, providing configuration, training, and ongoing support for KUB to ensure the full range of the TaKaDu solution is understood and applied. With the system deployed in eight weeks, immediately we could see how our 102 sensors, meters, and SCADA devices were performing. This simple view of our data stream allowed our team to identify a variety of telemetry and sensor installation issues that then became a primary focus for completing our DMA buildout,” said Tyree.
Furthermore, TaKaDu determined where DMAs, meters, and sensors were not associated properly or where DMAs were not, in fact, closed areas. Addressing these TaKaDu findings, along with the hardware configurations, solidified KUB’s implementation of the DMAs.
Before TaKaDu, KUB engineers had to talk to data experts to access SCADA data. TaKaDu has made the data accessible to staff throughout KUB directly to see events, view comments from others, and share information across work shifts. Users can access the system directly and not have to physically talk to people to understand current event and system performance characteristics (although the direct discussions will continue and remain valuable).
TaKaDu events enable KUB engineers to drill down and associate network performance data and to identify the root causes of issues and how to act on them. The event management tools allow KUB to define an action, priorities, and assign them to teams so that we are working on the top priority items without losing track of less important events. KUB also has a better understanding of event lifecycles where pipe leaks may progress to busts through progressive leaking or pressure increases.
“This data driven insight will help us proactively reduce emergency events that we previously had no forewarning of“, added Tyree. “It’s surprising how quickly KUB has begun to rely on data for its system management. Our motivation for using TaKaDu is for overall optimization of the water network and our staff resources. It is far beyond water loss management.”

